
Figure 3. Analysis of DEG in BM-MSC exposed to AML1/ETO9a leukemia.
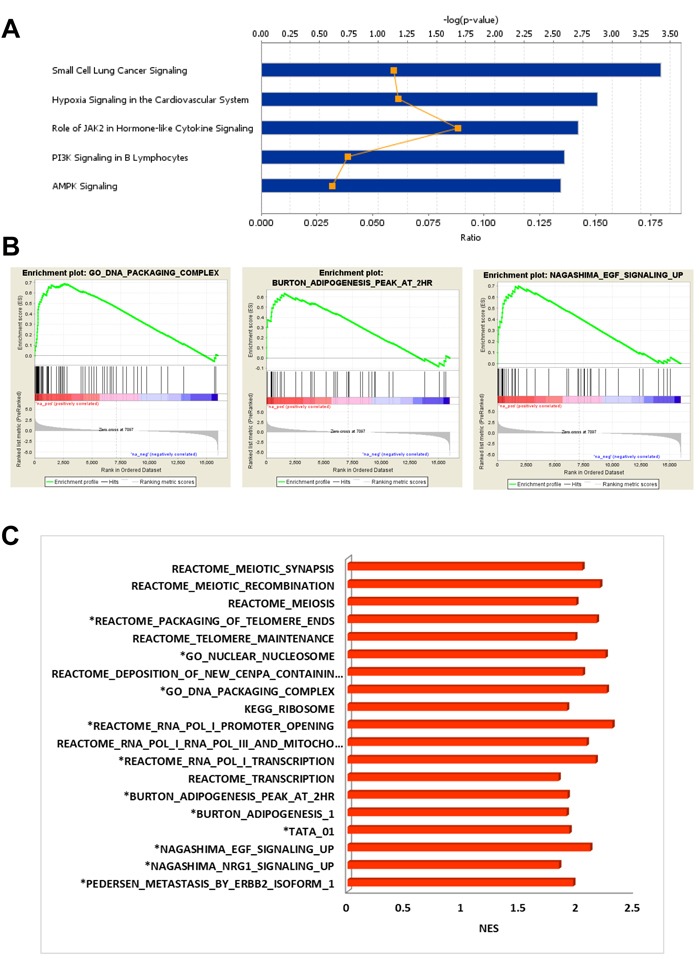
A., IPA Stacked Bar Chart of the most significant Canonical Pathways associated with up-regulated genes induced in BM-MSC by AML1/ETO9a leukemia. B., Examples of enrichment plots for the most significant enrichment sets for this dataset. Only enrichment sets with a normalized enrichment score (NES) ≥1.8 and ≤1.8 were considered as positive and negative associated respectively. C., Bar chart summarizing the most significant enrichment sets for this dataset.