
Figure 4. DEG in BM-MSC engrafted with MLL/ENL.
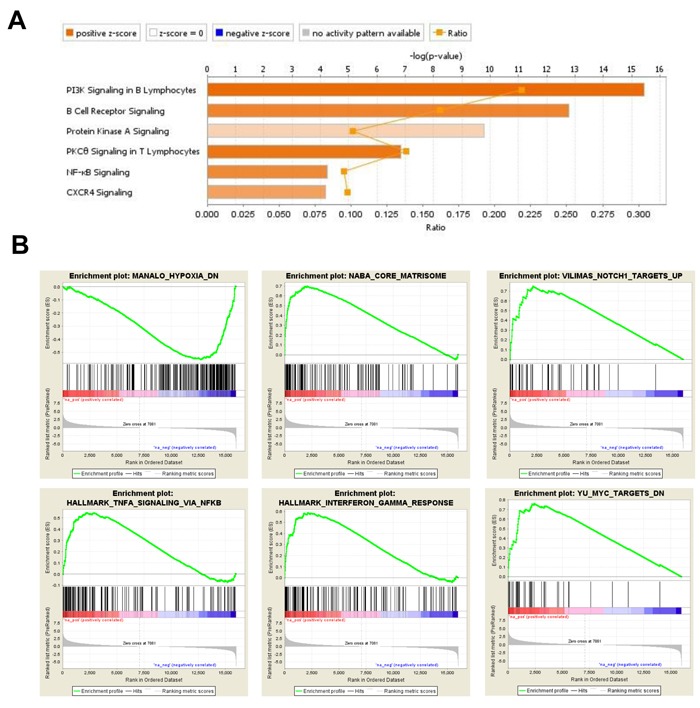
A., IPA displaying the most significant Canonical Pathways associated with up-regulated genes induced by MLL/ENL leukemia in BM-MSC. The Stacked Bar Chart displays the up-regulated genes molecules in each Canonical Pathway with regards to their z-score. The color orange reflects a positive direction of change for the function. Z-scores ≥ 2 indicate that the function has a statistically significant increase. B., Examples of enrichment plots for the most significant enrichment sets for this dataset. Only enrichment sets with a normalized enrichment score (NES) ≥1.8 and ≤1.8 were considered as positive and negative associated respectively.