
Figure 6. Gene expression analysis of DEG in BM-MSC from mice engrafted with MLL/ENL+FLT3-ITD Trp53 wt leukemia.
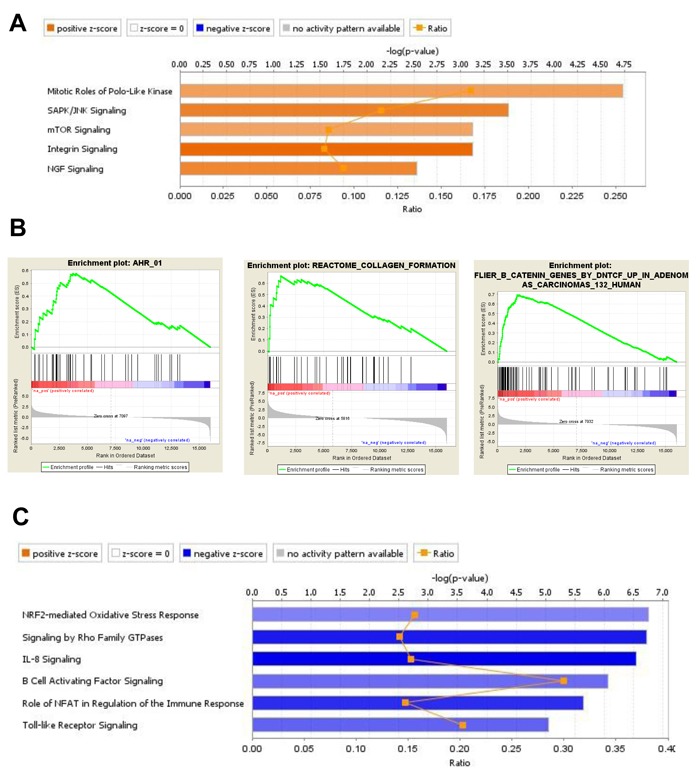
A., IPA displaying the most significant Canonical Pathways associated with up-regulated genes induced by MLL/ENL+FLT3-ITD Trp53 wt leukemia in BM-MSC. Orange equals positive direction of change for the function (Z-scores ≥ 2). B., Enrichment plots exemplifying the most significant enrichment sets for up-regulated genes in this condition. C., Canonical Pathways analysis (IPA) displaying the most significant pathways associated with down-regulated genes induced in BM-MSC by MLL/ENL+FLT3-ITD Trp53 wt leukemia (Z-scores ≤ -2).