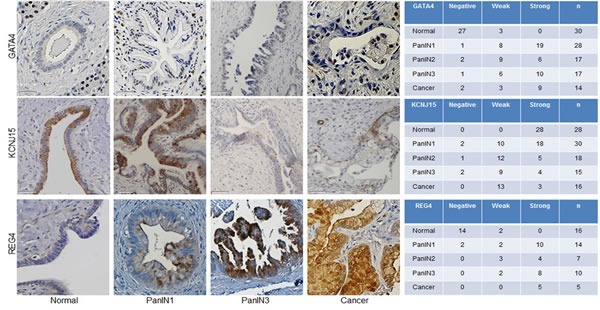
Figure 4. Protein expression alterations in PanIN and pancreatic adenocarcinoma.

Left, Representative immunohistochemistry images of normal pancreatic duct, PanINs and pancreatic cancer tissues for: Gata4, Kcnj15 and Reg4. Scale bar is 50 μm. Right, Number of tumor microarray cores at each labeling score (negative, weak, or strong).
