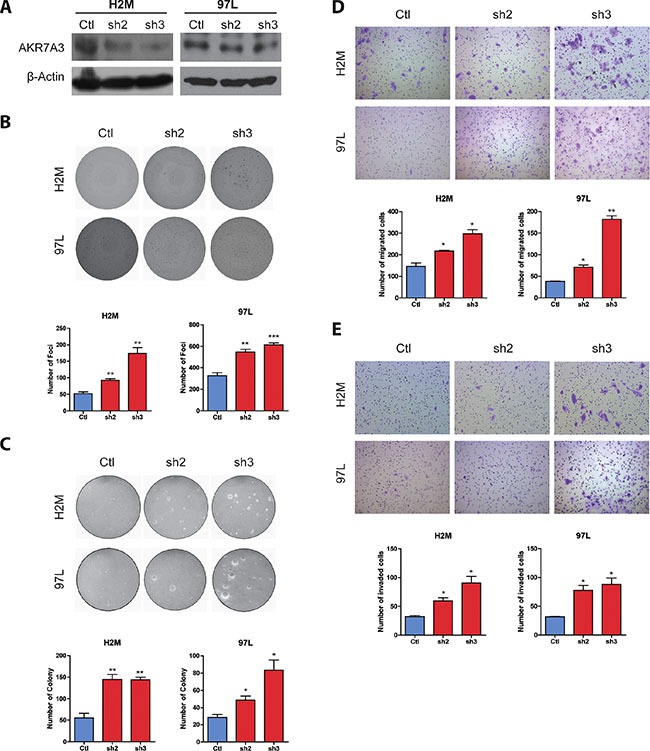
Figure 4. Knockdown of AKR7A3 induced tumorogenicity characteristics of HCC cell lines.

(A) Western blot showing successful knockdown of AKR7A3 in H2M and 97L cell lines. β-actin was used as loading control. (B) Representative images and quantification of foci formed by H2M and 97L vector and shRNA transfected cells. **P < 0.01, ***P < 0.001. (C) Representative images and quantification of colonies formed in soft agar assay by H2M and 97L vector and shRNA transfected cells. *P < 0.05, **P < 0.01. (D) Representative images and quantification of migrated and (E) invaded cells of H2M and 97L vector and shRNA transfected cells. *P < 0.05, **P < 0.01.
