
Figure 3. Effects of CRO on the protein expression level of ENaC α- and γ-subunits in H441 cells.
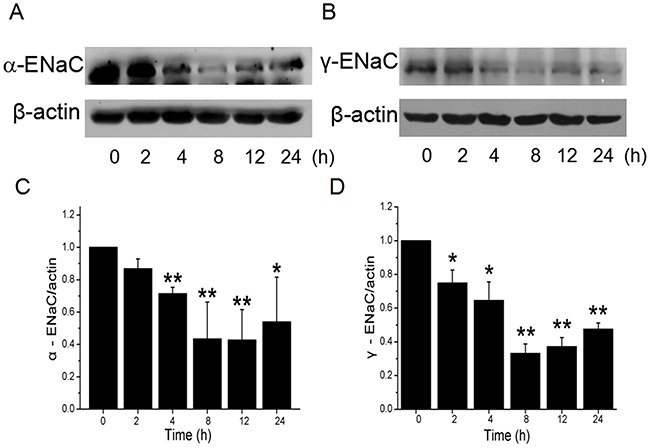
H441 cells were exposed to 80 μM CRO for 0 to 24 h and then proteins were extracted and analysed by western blot. (A, B) Western blots of α- and γ-ENaC protein demonstrating reductions in levels over time. Blots for β-actin were used as internal controls. (C, D) Graphical representation of data obtained from three sets of western blot assays for which bands were quantified using gray analysis (α-ENaC/β-actin and γ-ENaC/β-actin). Data are shown as the mean ± SE, *P < 0.05, **P < 0.01, compared with control.