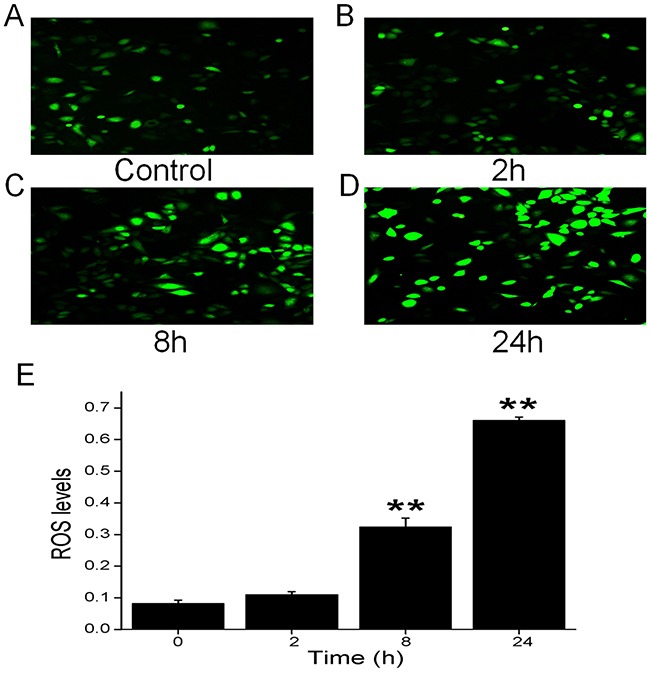
Figure 6. Effects of CRO on oxidative stress in H441 cells.

Production of ROS was measured by fluorescence microscopy using the fluorogenic substrate 2’,7’-dichlorofluorescein diacetate, which is oxidized to fluorescent 2’,7’-dichlorofluorescein. (A) Air-subjected control cell culture. (B-D) Cells exposed to 80 μM CRO for 2 h, 8 h, and 24 h. (E) The ROS levels were determined from the summary fluorescence intensity measured from the images of H441 cells (n = 25 in each group) that had been treated for different periods with CRO. Levels were corrected for background fluorescence. Data are shown as the mean ± SE, **P < 0.01, compared with control.
