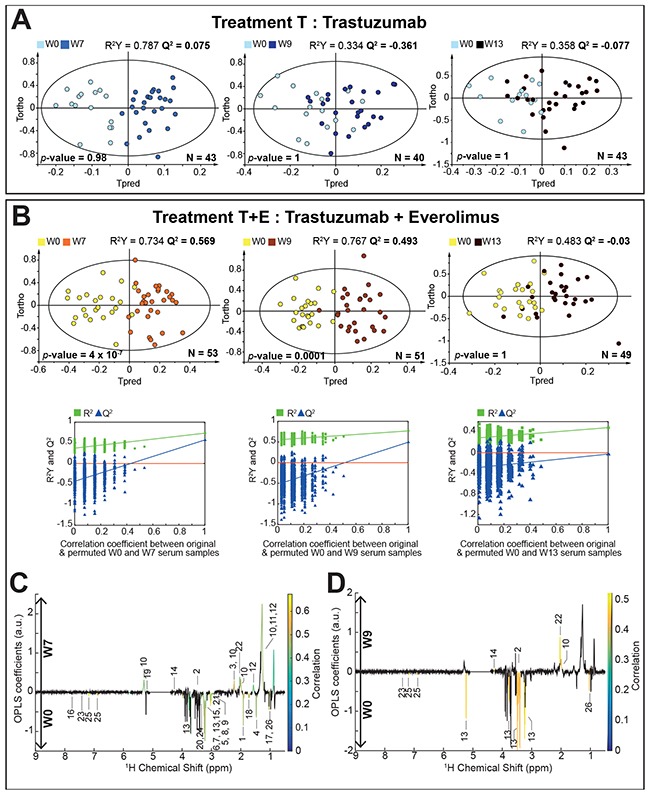
Figure 3. Discrimination between pre- and post-treatment serum samples.

(A) O-PLS models score plots for group T. evaluating samples at W0 vs. W7 (1+4 components, R2X = 0.715, R2Y = 0.787, Q2 = 0.075, CV-ANOVA p-value = 0.98), W0 vs. W9 (1+1 components, R2X = 0.531, R2Y = 0.334, Q2 = -0.361, CV-ANOVA p-value = 1) and W0 vs. W13 (1+1 components, R2X = 0.524, R2Y = 0.358, Q2 = -0.077, CV-ANOVA p-value = 1). (B) O-PLS models score plots for group T+E, discriminating samples at W0 vs. W7 (1+2 components, R2X = 0.625, R2Y = 0.734, Q2 = 0.569, CV-ANOVA p-value = 4.01 × 10⁻⁷), W0 vs. W9 (1+3 components, R2X = 0.660, R2Y = 0.767, Q2 = 0.493, CV-ANOVA p-value = 0.0001) and W0 vs. W13 (1+1 components, R2X = 0.515, R2Y = 0.483, Q2 = -0.03, CV-ANOVA p-value = 1). O-PLS model validations by re-sampling 1000 times the model under the null hypothesis for treatment B. (C) and (D) O-PLS loadings plots are represented for group T+E: W0 vs. W7 and W0 vs. W9, respectively. Statistically significant individual signals correspond to the colored spectral regions after Benjamini-Hochberg multiple testing correction. Highlighted candidate markers are: 1) Acetate, 2) Acetoacetate, 3) Acetone, 4) Alanine, 5) Albumin Lysyl, 6) Betaine, 7) Choline, 8) Creatine, 9) Creatinine, 10) Fatty acids, 11) Fatty acids (mainly LDL), 12) Fatty acids (mainly VLDL), 13) Glucose, 14) Glycerol backbone of PGLYs and TAGs, 15) Glycerophosphocholine, 16) Histidine, 17) Isoleucine, 18) Lysine, 19) Mannose, 20) Methanol, 21) Myo-inositol, 22) N-acetylglycoprotein (NAC1), 23) Phenylalanine, 24) Proline, 25) Tyrosine, 26) Valine.
