
Figure 1.
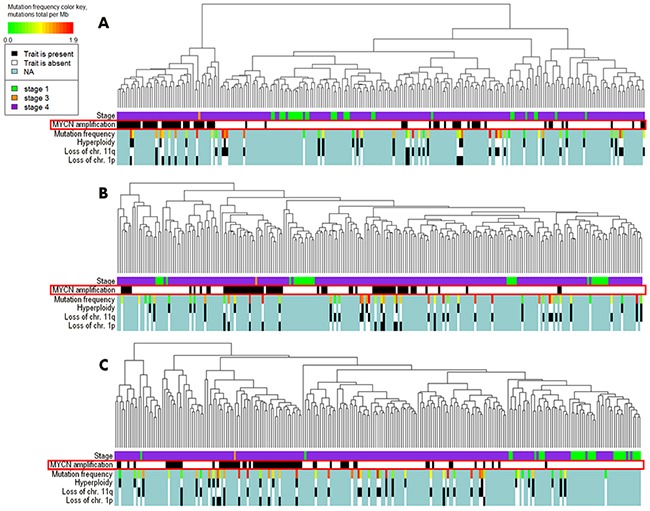
Hierarchical clustering of the TARGET project gene expression data at the levels of pathway activation strength (A), expression of all available genes (B) and expression of the available genes involved in the OncoFinder molecular pathway database (C). Clinical and diagnostic features such as the tumor stage, MYCN amplification status, mutation frequency, hyperploidy, loss of chromosomal 11q and 1p arms are shown where available on the corresponding marker bars.