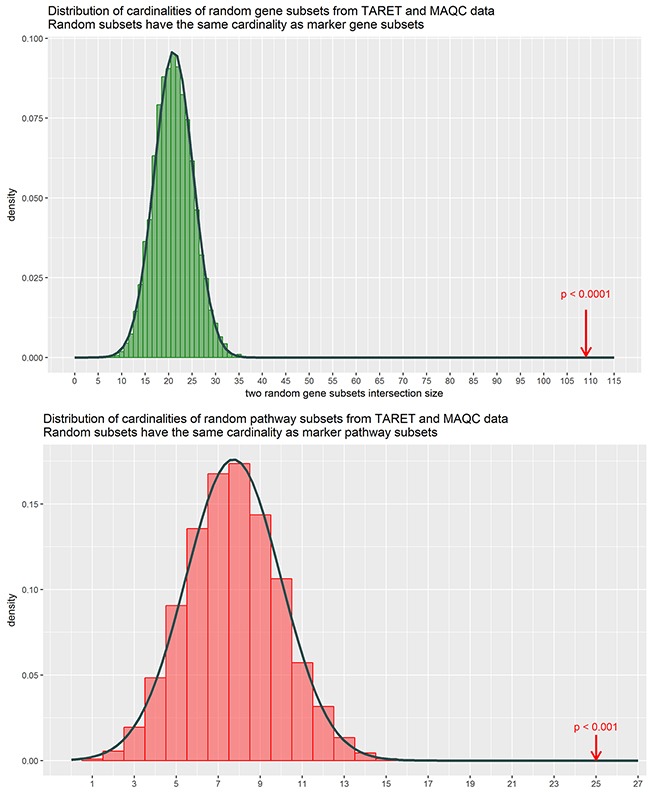
Figure 4. Distributions of cardinalities of random gene samplings from the MAQC and TARGET datasets.

The cardinalities were obtained by randomly subsetting genes (green) and patways (red) based on the TARGET and the MAQC data with the cardinalities matching that of the obtained marker subsets, and then intersecting them totally 10000 times. Cardinality of the intersection is shown on the horizontal axis. Arrows denote the true marker subset cardinalities, which lie outside of empirical distributions suggesting that these double discriminating genes / pathways are not merely a random noise.
