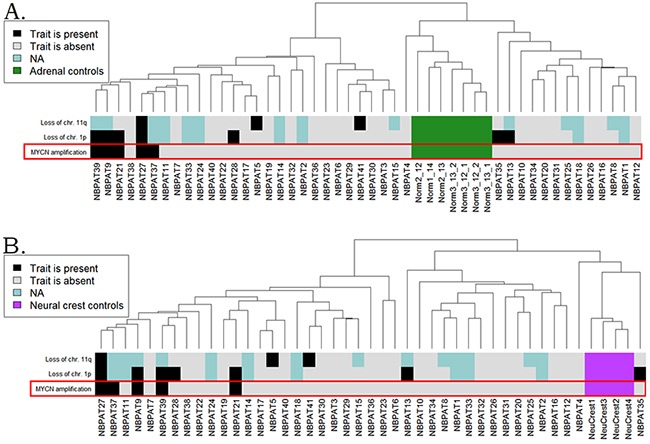
Figure 5.

Hierarchical clustering of the CustomArray experimental data at the level of pathway activation strength, normalized on the normal adrenal gland (A) and embryonic neural crest (B) controls. The diagnostic features such as MYCN amplification status, loss of chromosomal 1p and 11p arms, are shown on the corresponding marker bars.
