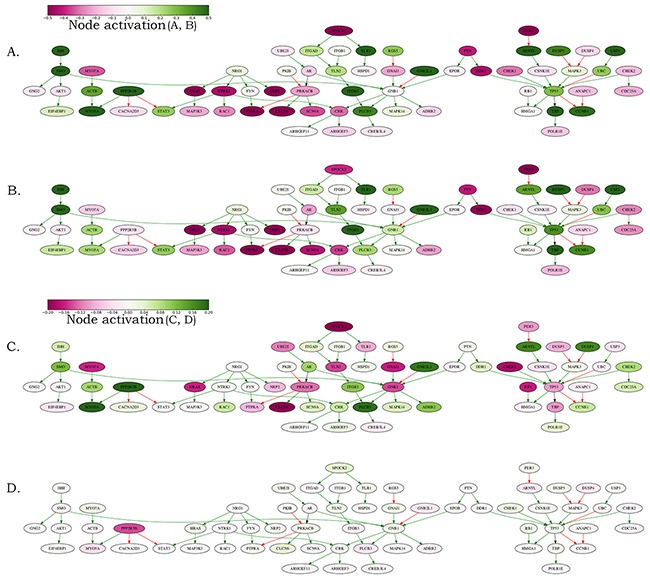
Figure 6. Schematic representation of the MYCN amplification molecular pathway.

The pathway activation features are shown for the averaged MYCN-amplified and non-amplified transcriptomes normalized on the normal adrenal gland controls and on the averaged neuroblastoma transcriptional profile. (A) MYCN-amplified, adrenal-normalized. (B) Non-amplified, adrenal-normalized. (C) MYCN-amplified, neuroblastoma-normalized. (D) Non-amplified, neuroblastoma-normalized. The pathway is shown as an interacting network, green arrows indicate stimulation, red arrows – inhibition. Color bars represent activations of the corresponding pathway nodes and correspond to the logarithms of the case-to-normal (CNR) expression rate for each node.
