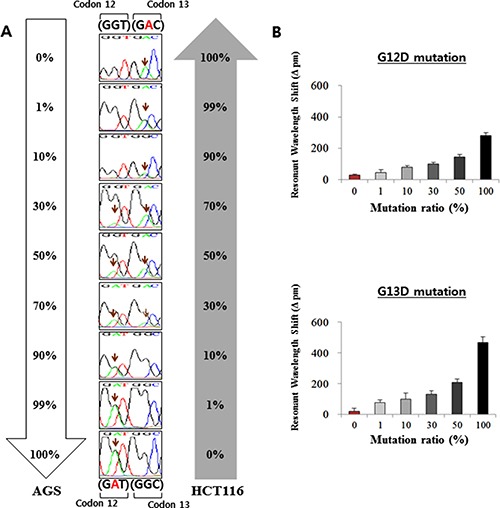
Figure 3. Analysis of the KRAS mutations with serially diluted mixed cells.

The AGS cells (containing the G12D mutation) were diluted with HCT116 (containing the G13D mutation) cells. The percentages of the mutant cells were 0%, 1%, 10%, 30%, 50%, and 100%. (A) the results of direct sequencing, following the dilution of the AGS and HCT116 cell lines. (B) Shift in the resonant wavelength using the ISAD-KRAS assay in the diluted mutation cells with either the G12D mutant primer (upper) or the G13D mutant primer (lower). The error bars indicate the standard deviation of the mean, based on at least 3 independent experiments.
