
Figure 1. Time course of CG-induced expression of phospho-Src and total Src in the peritoneum.
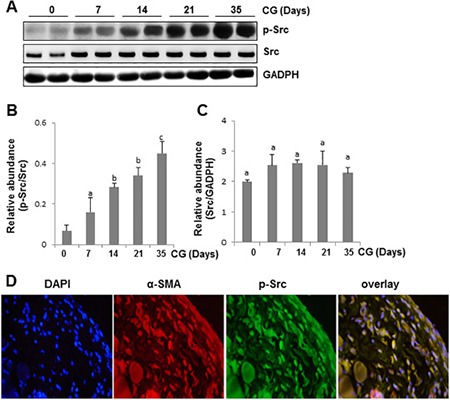
(A) Peritoneal membrane lysates were subject to immunoblot analysis with specific antibodies against p-Src, Src or GADPH. (B) Expression levels of p-Src were quantified by densitometry and normalized with Src. (C) Expression levels of Src were quantified by densitometry and normalized with GADPH. Data are represented as the mean ± SEM (n = 6). Bars with different letters (a–c) are significantly different from one another (P < 0.05). (D) Photomicrographs illustrate co-staining of α-SMA and p-Src in the peritoneum collected 21 days after CG injection. DAPI, 4′,6-diamidino-2-phenylindole.