
Figure 4. Downregulation of IDH1 reduces Cav1 expression through α-KG-mediated epigenetic regulation.
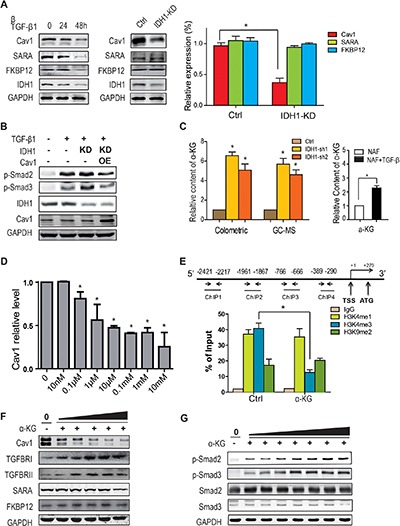
(A) Western blots showing the downregulated protein levels of Cav1 in IDH1-knockdown fibroblasts. The protein levels and mRNA levels of Cav1, FKBP12 and SARA were detected in primary fibroblasts treated with TGF-β1 (8 ng/ml) for 24 or 48 hours (n = 3, *p < 0.01). (B) Overexpression of Cav1 significantly attenuated the TGF-β1-induced phosphorylation of Smad2/3 in 293T cells depleted of IDH1. The plasmids containing IDH1 shRNA1 or/and Cav1 coding sequences were transfected into 293T cells, which were treated with TGF-β1 for 1 hour before harvest. (C) α-KG was increased in IDH1-knockdown fibroblasts and TGF-β-treated fibroblasts. The concentrations of α-KG in primary or IDH1-knockdown fibroblasts were analysed by GC-MS and α-KG assay kit (n = 3, *p < 0.01). (D) α-KG decreased the expression of Cav1. Primary fibroblasts were treated with α-KG at the indicated doses (10 nM, 0.1 μM, 1 μM, 10 μM, 0.1 mM, 1 mM, and 10 mM) for 24 hrs. The mRNA levels were normalised to GAPDH (n = 3, *p < 0.01). (E) ChIP assay showing that the trimethylation level of H3K4 decreased in the Cav1 promoter region after α-KG treatment. Chromatin IP assays of HEK293T cells, with or without 1 mM α-KG treatment for 24 hours, were performed using antibody against H3K4me1, H3K4me3, H3K9me2 or IgG and analysed by real-time PCR (n = 3, *p < 0.01). (F) The protein level of Cav1 gradually decreased with increasing α-KG concentration. The primary fibroblasts were treated for 48 hours with the indicated doses of α-KG (left to right: 1 μM, 10 μM, 0.1 mM, 1 mM, and 10 mM). (G) The phosphorylation of Smad2 and Smad3 was also gradually increased with increasing α-KG concentration. Primary fibroblasts were treated for 1 hour with α-KG at the indicated doses (left to right: 10 nM, 100nM, 1 μM, 10 μM, 0.1 mM, 1 mM, and 10 mM).