
Figure 6. Low levels of NEO1 are related with BCC aggressiveness.
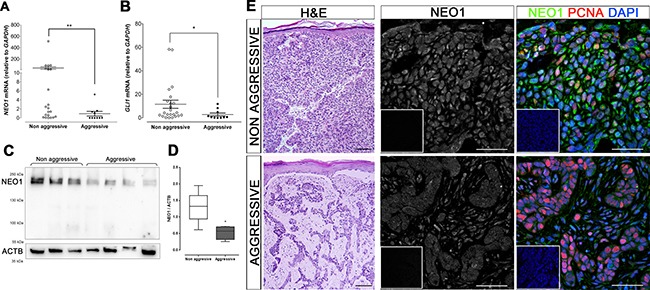
(A–E) Subtypes of sporadic human BCC samples were assessed by histomorphological analysis. mRNA levels of both NEO1 (A) and GLI1 (B) of aggressive BCC subtypes (n = 10) are significantly lower than levels of non-aggressive BCC (n = 22). Data is represented as mean ± SEM with *p < 0.05, **p< 0.01; according to Mann-Whitney test. (C) Representative WB membrane of NEO1 expression in non-aggressive and aggressive BCC subtypes, ACTB is shown as a loading control. (D) The levels of NEO1 in non-aggressive BCC is higher than in aggressive BCC subtypes. Data correspond to n = 8 for non-aggressive BCC samples and n = 4 for aggressive BCC samples and are normalized against ACTB expression. *p < 0.05, according to Mann-Whitney test. (E) H&E of representative BCC biopsies (left column, bar = 250 μm) show histological differences between aggressive and non-aggressive BCC subtypes. IF for NEO1 (green) and PCNA (red) of tumor nodules of these samples show strong staining on non-aggressive tumor cells and dimmer staining for aggressive tumor cells. DAPI (blue) was used for nuclei staining (bar = 50 μm). Negative controls are shown as insets.