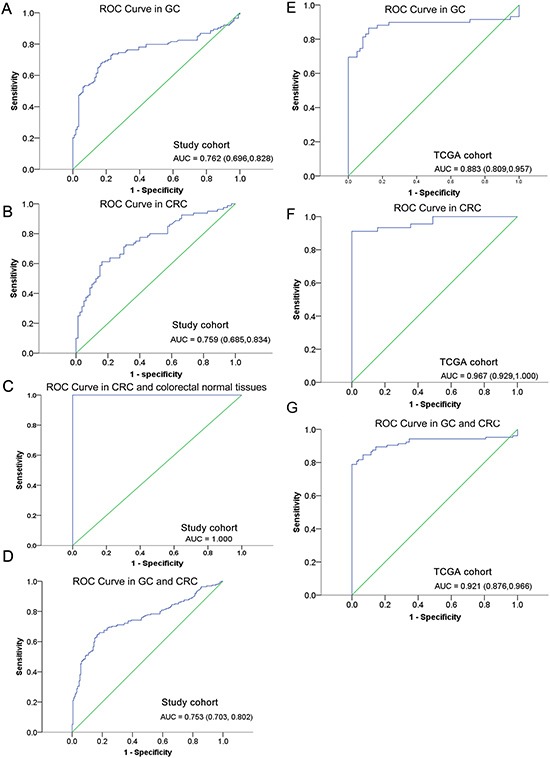
Figure 3.

ROC curves for the diagnostic value of TFPI2 hypermethylation in (A) GC patients, (B) CRC patients, (C) CRC and colorectal normal tissues, and (D) combined individuals from study cohort, and (E) GC patients, (F) CRC patients, (G) combined individuals from TCGA cohort. ROC: receiver operating characteristic. AUC: area under the curve.
