
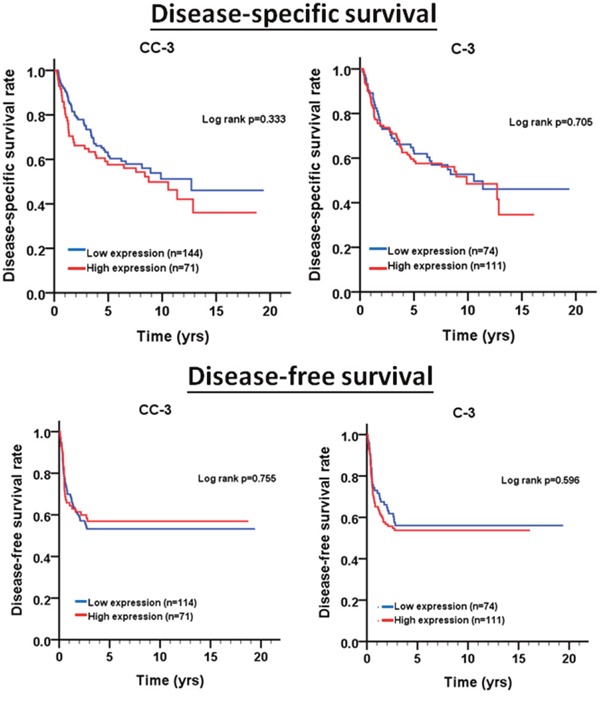
Figure 2. Survival curves depicting DSS and DFS of BMSCC patients according to the expression levels of cleaved caspase-3 (CC-3) and caspase-3 (C-3).
Official websites use .gov
A
.gov website belongs to an official
government organization in the United States.
Secure .gov websites use HTTPS
A lock (
) or https:// means you've safely
connected to the .gov website. Share sensitive
information only on official, secure websites.