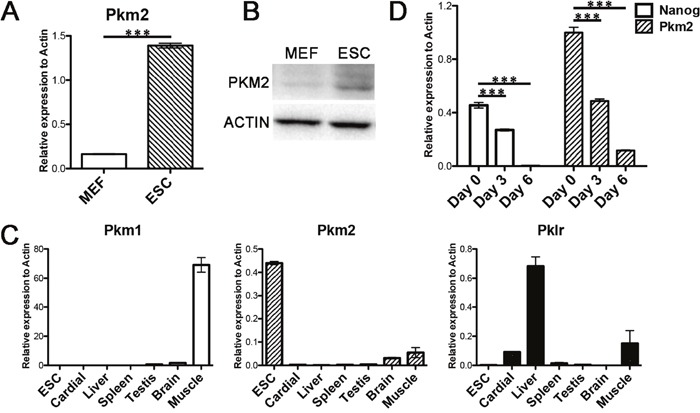
Figure 1. Pkm2 was predominantly expressed in ESCs.

(A) RNA level of Pkm2 in MEFs and ESCs. (B) Protein level of Pkm2 in MEFs and ESCs. (C) Real-time PCR examining the expression of Pkm1, Pkm2 and Pklr in the indicated tissues. (D) Real-time PCR examining the expression changes of Nanog and Pkm2 at the indicated time point during the differentiation of ESCs. All statistical analyses are unpaired Student's t tests, and significance is annotated as not significant (ns), *p ≤ 0.05, **p ≤ 0.01, or ***p ≤ 0.001. Data represented as mean ± SD; n = 3.
