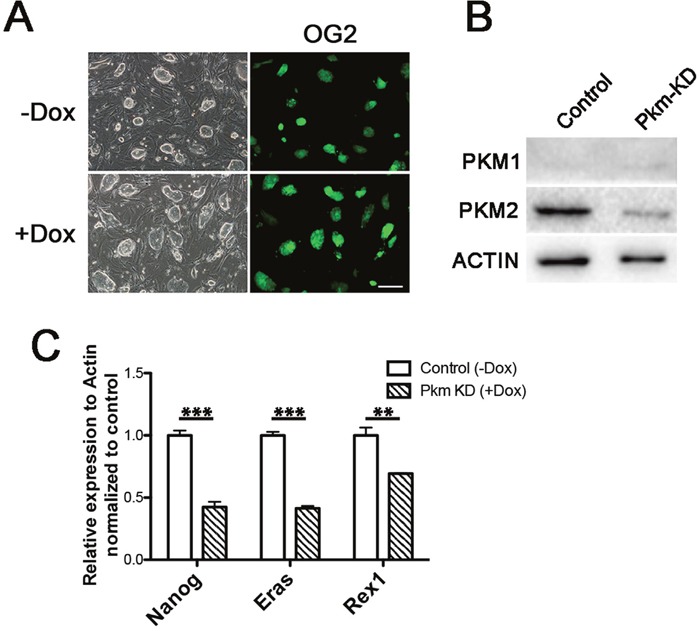
Figure 3. Knockdown of Pkm affected pluripotent genes.

(A) Morphology of the inducible Pkm knockdown ES cell lines without (upper) or with (lower) Dox addition. (B) Western blot showing the knockdown of Pkm1 and Pkm2 in established ES cell lines. (C) Real-time PCR examining the expression changes of Nanog, Eras and Rex1 under Pkm knockdown in ESCs. Scale bars represent 200 μm. Data represented as mean ± SD; n = 3.
