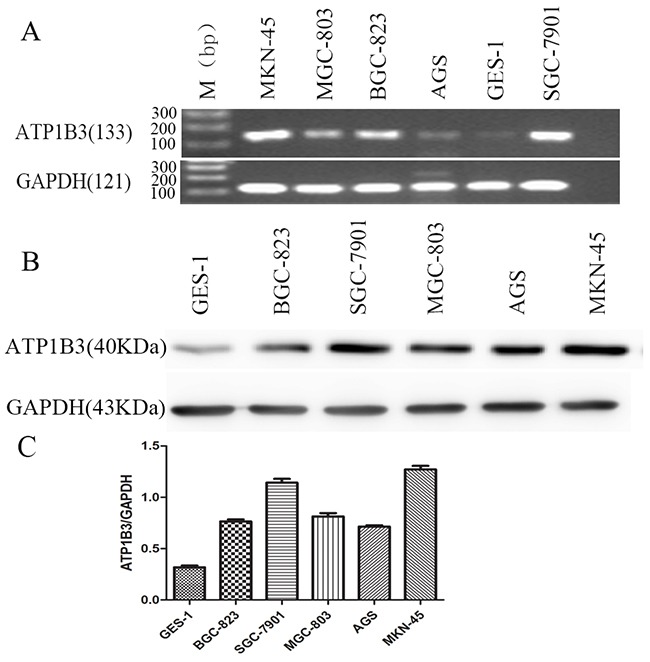
Figure 2. ATP1B3 mRNA and protein levels in gastric cancer cell lines.

(A) ATP1B3 mRNA expression levels in gastric cancer cell lines by RT-PCR. RT-PCR results showed that ATP1B3 was expressed in gastric cancer cells and GES-1 cells with different degrees of differentiation. (B) ATP1B3 protein expression levels in gastric cancer cell lines by Western blot. GAPDH was used as the endogenous control. M: Marker. ATP1B3 protein expression was increased in gastric cancer cells compared with normal gastric epithelial cells. (C) The relative integrated density values are expressed as the mean±SD. The results are representative of three independent experiments. Based on the average value, the expression level of ATP1B3 in SGC-7901 and MMKN-45 cells was higher.
