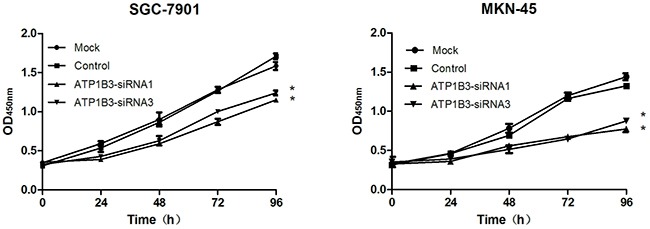
Figure 4. Knockdown of ATP1B3 led to the inhibition of SGC-7901 and MKN-45 cell proliferation.

Cells were cultured in 96-well plates and analysed by CCK-8 assay. Cell proliferation curves are shown after 96 hours. The absorbance value at a 450-nm wavelength in the ATP1B3-siRNA group was significantly lower than that in the Mock and Control groups. As time passed, the proliferation of ATP1B3-siRNA cells was more significantly inhibited. Mock, non-infected control cells; Control, cells infected with si-NC; ATP1B3-siRNA1, cells infected with ATP1B3-siRNA1; ATP1B3-siRNA3, cells infected with ATP1B3-siRNA3. *P<0.05 vs. Control.
