
Figure 2. Relative mtDNA content in tumor tissues (T) and matched non-tumor tissues (N).
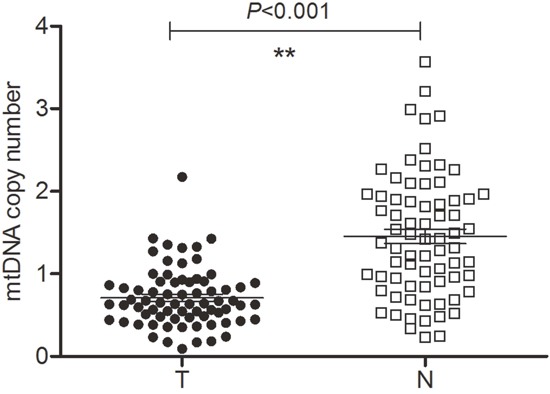
Mean T mtDNA content was significantly lower (0.71 ± 0.042) than N (1.45 ± 0.088) (P < 0.001).
Official websites use .gov
A
.gov website belongs to an official
government organization in the United States.
Secure .gov websites use HTTPS
A lock (
) or https:// means you've safely
connected to the .gov website. Share sensitive
information only on official, secure websites.
Mean T mtDNA content was significantly lower (0.71 ± 0.042) than N (1.45 ± 0.088) (P < 0.001).