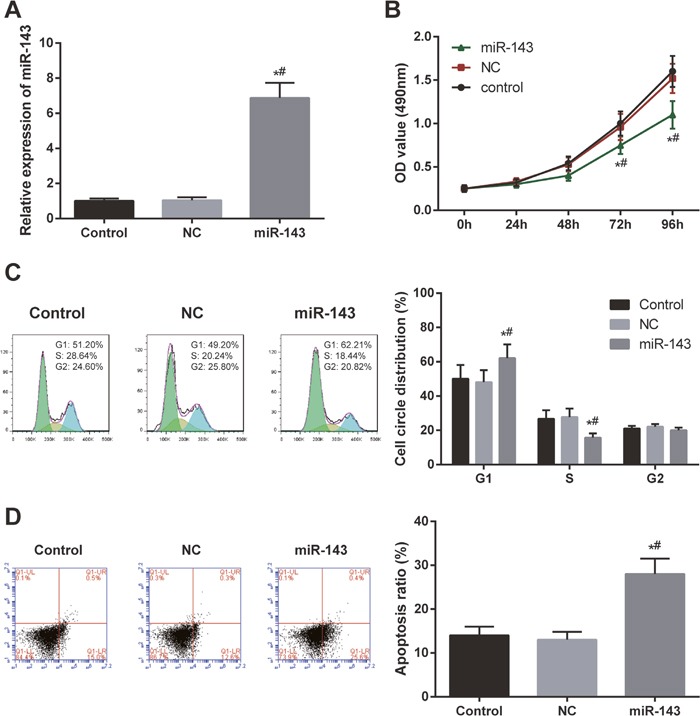
Figure 2. Overexpression of miR-143 inhibited cell proliferation and induced apoptosis of the cells.

(A) The expression of miR-143 in HEC-1B cells dramatically increased after transfection with miR-143 mimics. (B) Overexpression of miR-143 suppressed HEC-1B cell viability. (C) Overexpression of miR-143 induced EC cell cycle arrest. X axis indicates DNA content and Y axis indicates cell number. Color green: G1 phase; yellow: M phase; blue: G2/M phase. (D) Overexpression of miR-43 promoted EC cell apoptosis observed by FCM. X axis indicates AnnexinV fluorescence intensity and Y axis indicates PI fluorescence intensity. * P<0.05 relative to control group, # P<0.05 relative to NC group.
