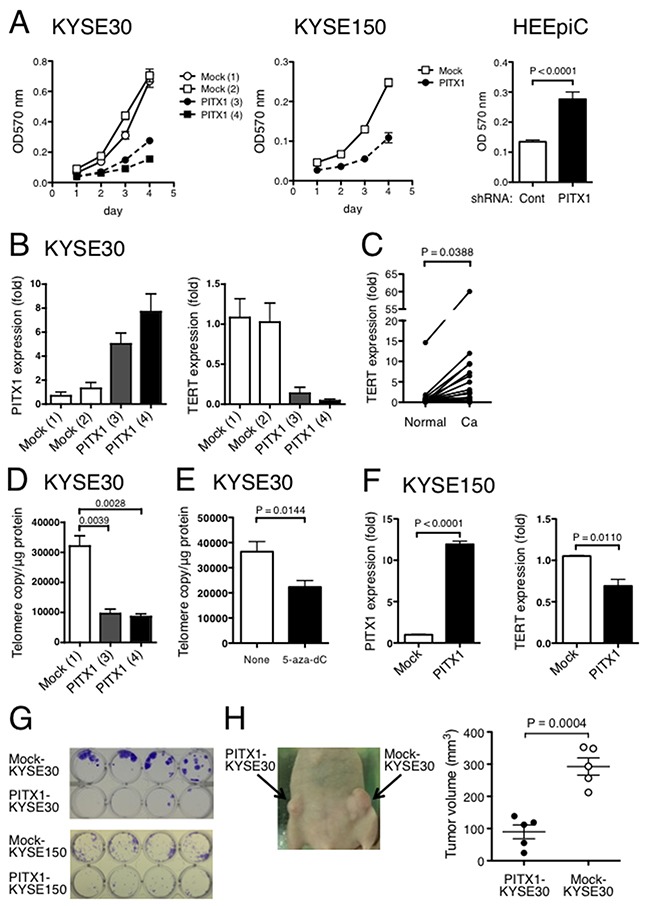
Figure 3. Ectopic expression of PITX1 suppressed ESCC cell growth in vitro and in vivo.

(A) Growth curves of PITX1-transfected and mock-transfected KYSE30 clones and KYSE150 stable transfectants as determined by MTT assay (left). HEEpiC cells were transiently transfected with control or PITX1-shRNA. Forty-eight hours after transfection, cell growth was assessed by MTT assay (right). Data are shown as mean ± SD of assays performed in triplicate. (B) PITX1 (left) and TERT (right) mRNA levels in 2 mock-transfected and 2 PITX1-transfected clones of KYSE30 cells. Numbers in parentheses indicate clone names. Data are shown as mean ± SD of assays performed in triplicate. (C) Increased expression of TERT in ESCC. TERT transcript levels were measured in paired samples from 32 ESCC samples by RT-PCR. Data are reported as expression relative to the mean level in normal tissues. (D) Telomerase activity in PITX1-transfected and mock-transfected clones of KYSE30 cells. Data are shown as mean ± SD of assays performed in triplicate. (E) Inhibition of telomerase activity in KYSE30 cells after treatment with 5 μM of 5-aza-dC. Data are shown as mean ± SD, assays were repeated five times. (F) PITX1 (left) and TERT (right) mRNA levels in stably mock-transfected and PITX1-transfected KYSE150 cells. Data are shown as mean ± SD of assays performed in triplicate. (G) Colony formation of stably PITX1-transfected and mock-transfected KYSE30 and KYSE150 cells. Cells were cultured for 2 weeks. Colonies were visualized by crystal violet staining. (H) Representative images of subcutaneous xenografts (left). Nude mice were subcutaneously inoculated with PITX1-transfected KYSE30 cells in the right flank and mock-transfected KYSE30 cells in the left flank. Three weeks after inoculation, tumor volumes were measured.
