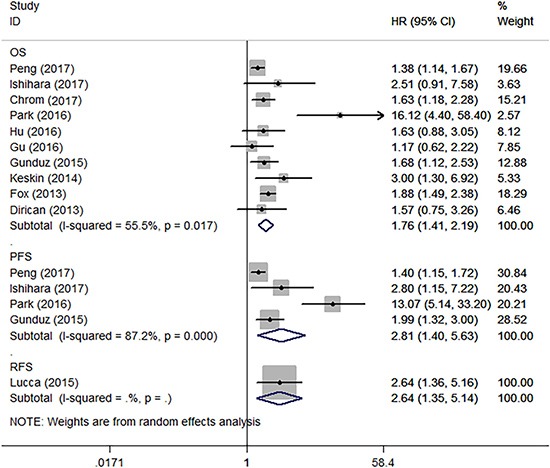
Figure 2. Forest plot reflects the association between PLR and oncologic outcomes.

OS = overall survival, PFS = progression-free survival, RFS = recurrence-free survival.

OS = overall survival, PFS = progression-free survival, RFS = recurrence-free survival.