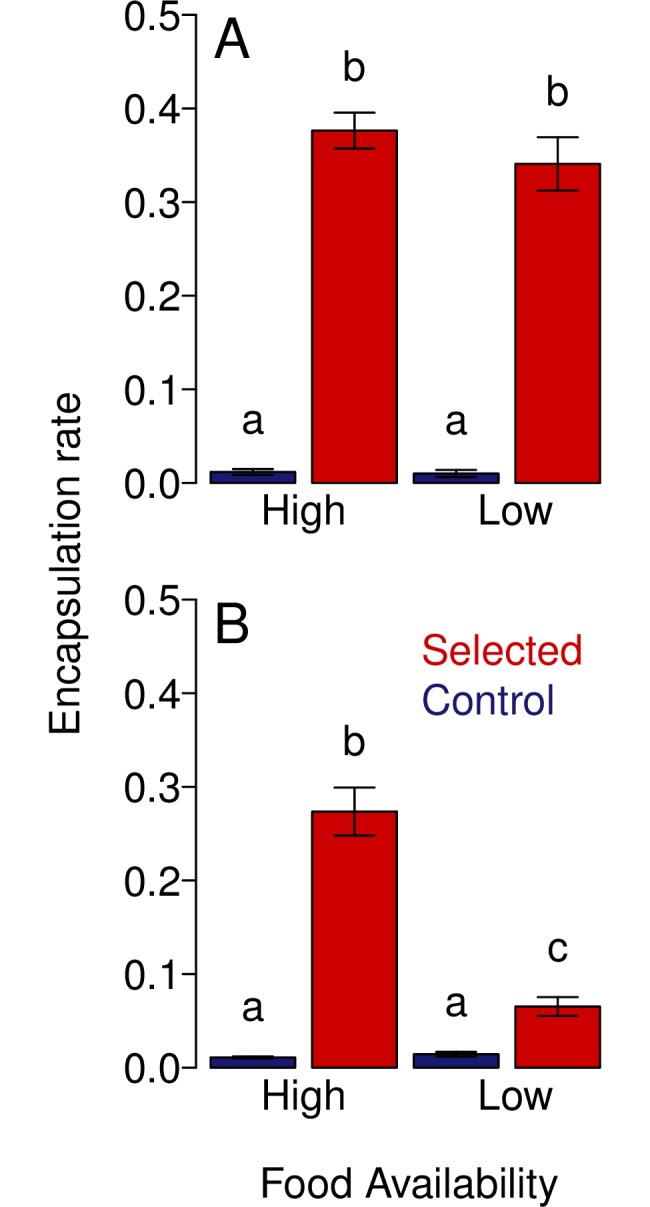
Fig 5. The change in encapsulation rate of populations maintained in high and low food environments.

A) The mean encapsulation rates of selected populations split into high and low food treatments at generation 0 prior to maintenance on their respective regimes. B) The mean encapsulations rates of selected and control populations following five generations of maintenance in either a high or low food environment. Bars represent SE. Different letters denotes means that are significantly different from one another, with significance defined as a p value of <0.05 (Tukey multiple comparison test) and these differences are only considering comparisons within a given panel.
