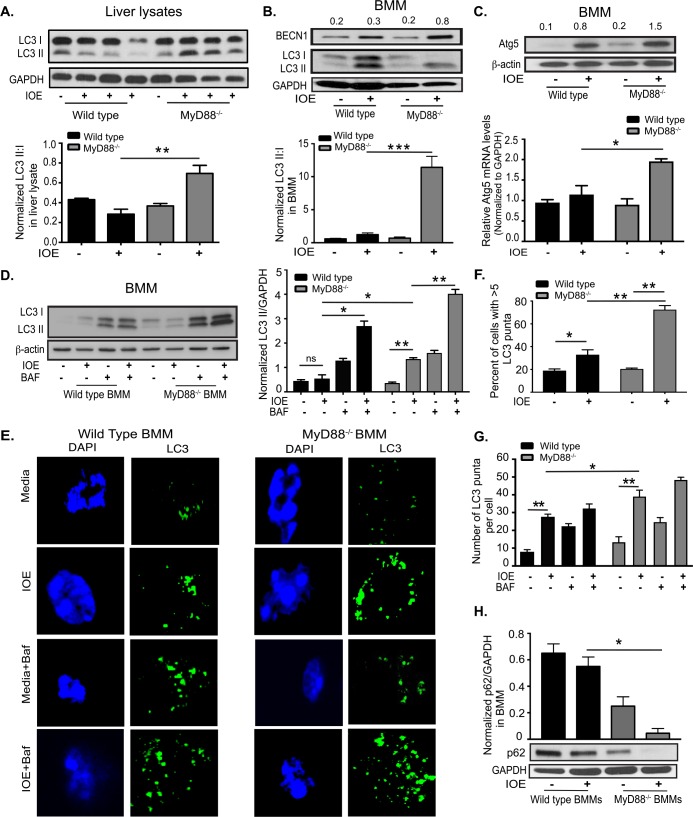
Fig 3. MyD88 inhibits autophagy in vivo and in Ehrlichia-infected macrophages.
(A) Western blot of LC3I and LC3II in whole liver lysates from uninfected and IOE-infected WT and MyD88-/- mice on day 7 p.i. Each lane represents one mouse and results representative of n = 9 per infected group and n = 9 of uninfected mice. The density of LC3II:LC3I bands in each group were quantified and normalized to GAPDH expression (lower graph). (B) Immunoblotting analysis of LC3I, LC3II and beclin-1 (BECN1) in uninfected and IOE-infected WT and MyD88-/- BMM at 24h p.i. LC3II:I ratio was normalized to GAPDH (lower graph). (C) Immunoblotting analysis of Atg5 in uninfected and IOE-infected WT and MyD88-/- BMM at 24h p.i. Normalized values for beclin 1 and Atg5 expression are indicated above the western blot bands. mRNA expression of Atg5 in uninfected and IOE-infected WT and MyD88-/- BMM at 24h p.i. (D) Immunoblot of LC3I and LC3II in WT-BMM and MyD88-/- BMM at 24h p.i. in the presence/absence of Baf. Quantification of LC3II band density normalized to GAPDH (middle graph). (E) Confocal immunofluorescent staining of LC3 (green) and nuclear DAPI staining (blue) in uninfected and IOE-infected WT and MyD88-/- BMM treated with/without bafilomycin (Baf) at 24h p.i. (F) Quantification of percentage of cells with more than 5 LC3 puncta. (G) The number of LC3 puncta per cell quantified by confocal microscopy. (H) Immunoblot of p62 in uninfected and IOE-infected WT and MyD88-/- BMM at 24h p.i. with p62 normalized to GAPDH loading control. All results are presented as mean ± SD (* P<0.05, **P<0.01, ***P<0.001) from three independent in vitro experiments. Quantification of immunoblots is presented as mean pixel density of bands/GAPDH from three mice/group and is representative of three independent experiments. All confocal images representative of at least three independent experiments and are representative of 10 high power fields (HPF).

