
Figure 2.
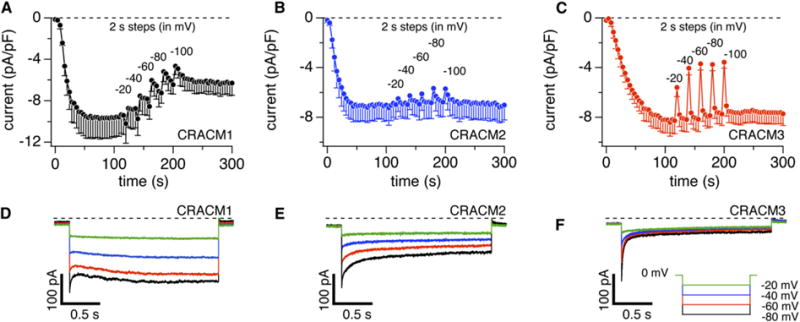
CRACM Homologs Have Distinct Fast and Slow Ca2+-Dependent-Inactivation Properties
(A) Average CRAC current densities at −80 mV induced by IP3 (20 μM) with 10 mM EGTA in stable STIM1-expressing HEK293 cells transiently overexpressing CRACM1 (n = 3; total n = 8 and three cells with the smallest current densities were averaged to approximate the lower current densities of CRACM2 and CRACM3). CRAC currents were monitored continuously by voltage ramps spanning −100 mV to +100 mV over 50 ms delivered at a rate of 0.5 Hz. After CRAC currents were fully activated (120 s), rectangular voltage pulses of 2 s duration were delivered to various negative voltages (see [D]–[F]) interspaced by 10 ramps. Error bars indicate SEM.
(B) Experimental protocol as described in (A), but for CRACM2-expressing cells. Note the minor fast inactivation and virtual absence of slow inactivation. Error bars indicate SEM.
(C) Experimental protocol as described in (A), but for CRACM3-expressing cells. Note the significant fast inactivation and virtual absence of slow inactivation. Error bars indicate SEM.
(D) Average CRAC currents evoked by step pulses (2 s duration) to −20 mV (green), −40 mV (blue), −60 mV (red), and −80 mV (black) in cells expressing CRACM1 (n = 3, same cells as in [A]). At the beginning of each pulse, 2.5 ms were blanked out so that residual capacitative artifacts could be eliminated.
(E) Average CRAC currents evoked by step pulses from −20 mV to −80 mV in cells expressing CRACM2 (n = 4, same cells as in [B]).
(F) Average CRAC currents evoked by step pulses from −20 mV to −80 mV in cells expressing CRACM3 (n = 5, same cells as in [C]).