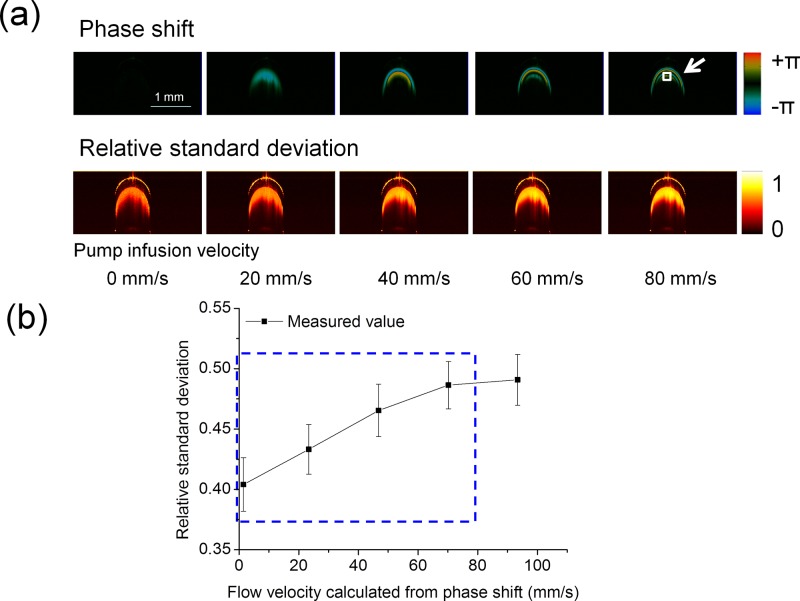
FIG. 4.
Calibration of the RSD-OCT system using rat whole blood. (a) Phase shift images and RSD images during the increase of infusion velocities at a Doppler angle of 120°. (b) Relationship between the RSD value and the flow velocity in the region indicated by the white solid box in (a): the RSD value increases with increase in the flow velocity until RSD saturation. When the pump infusion velocities were 0, 20, 40, 60, and 80 mm/s, the local velocities calculated by the phase shifts were 1.5 mm/s, 23.4 mm/s, 46.8 mm/s, 70.2 mm/s, and 93.4 mm/s in the indicated region. Error bars represent the standard deviations of RSD values from 100 replications.

