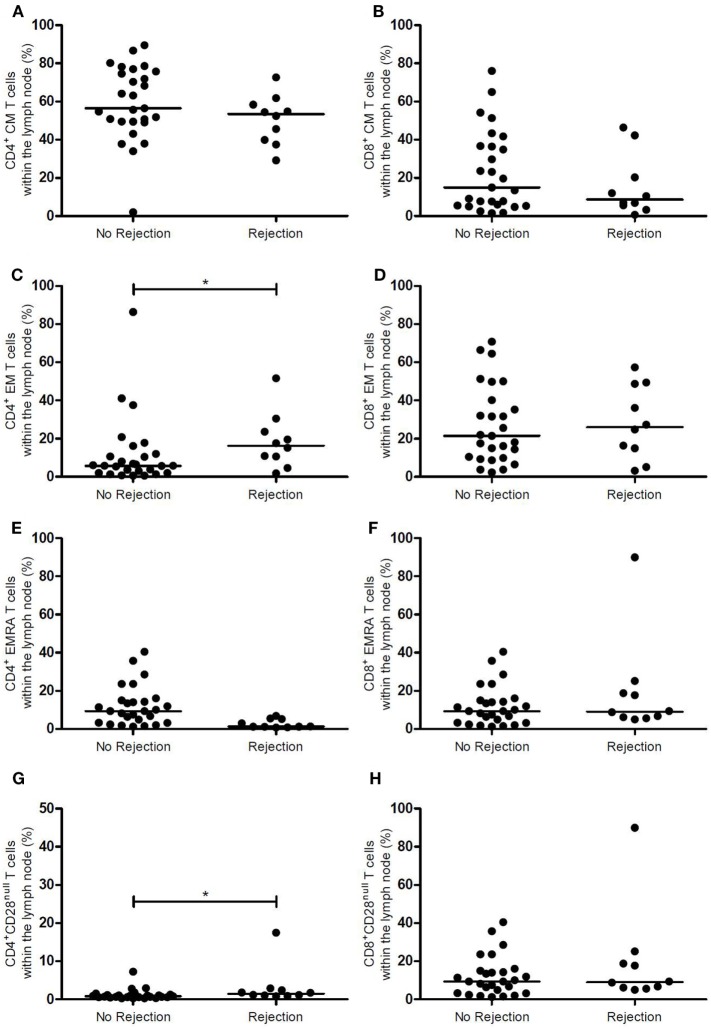
Figure 2.
Memory CD4+ and CD8+ T-cell subsets and CD28 expression in the lymph node between rejection and no rejection groups. (A) Frequencies of CD4+ CM T cells, (B) CD8+ CM T cells, (C) CD4+ EM T cells, (D) CD8+ EM T cells, (E) CD4+ EMRA T cells, (F) CD8+ EMRA T cells, (G) CD4+CD28null T cells, and (H) CD8+CD28null T cells within the lymph nodes are shown between the no rejection and rejection groups. Data are presented with individual percentages and medians. Significant differences were calculated and shown (*p < 0.05, **p ≤ 0.01, ***p ≤ 0.001). CM, central memory; EM, effector memory; EMRA, effector memory CD45RA+.

