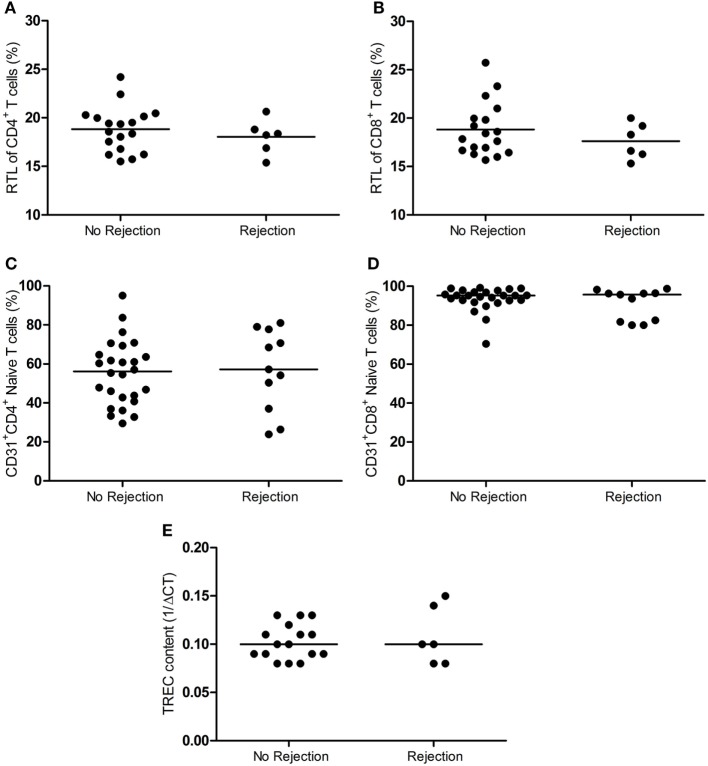
Figure 3.
RTL, RTE frequency and TREC content in the lymph node between rejection and no rejection groups. The RTL of (A) CD4+ T cells and (B) CD8+ (T cells) within the lymph nodes between the no rejection and rejection groups are shown. Frequencies of (C) CD4+ and (D) CD8+ RTEs (CD31+ naïve T cells) within the lymph nodes between the no rejection and rejection group are shown. (E) The TREC content (1/ΔCT) within the lymph nodes between the no rejection and rejection group is shown. Data are shown as individual points and medians. Significant differences were calculated and shown (*p < 0.05, **p ≤ 0.01, ***p ≤ 0.001). RTEs, recent thymic emigrants; RTL, relative telomere length; TREC, T-cell receptor excision circle.

