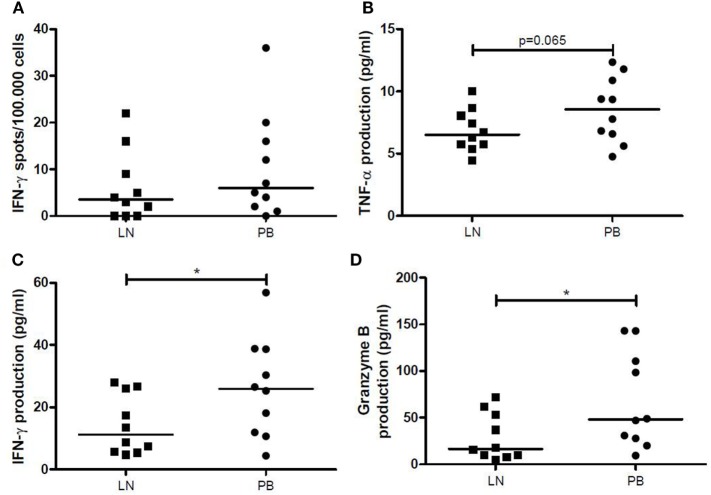
Figure 5.
IFN-γ, TNF-α, and granzyme B production after allogeneic stimulation. (A) The number of IFN-γ spots per 100,000 cells by LNMCs and PBMCs after allogeneic stimulation for 1 day is shown. The production of (B) TNF-α, (C) IFN-γ, and (D) granzyme B (pg/mL) by LNMCs and PBMCs after allogeneic stimulation for 6 days is shown. Data are shown as individual points and medians. Significant differences were calculated and shown (*p < 0.05, **p ≤ 0.01, ***p ≤ 0.001). IFN-γ, interferon-gamma; LNMCs, lymph node mononuclear cells; PBMCs, peripheral blood mononuclear cells; TNF-α, tumor necrosis factor-alpha.

