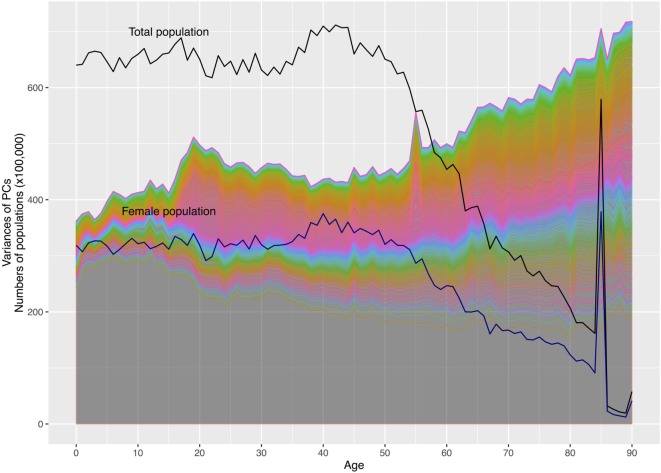
Figure 2.
The numbers of population and variances of principal components (PCs) by age. Note: the area under the first lowest curve represents the variance of the first principal component (PC1); the area between the first and second lowest curves represents the variance of the second PC (PC2); this principle applies to other areas under curves. There are 525 PCs in the graph. The upper black solid line represents the numbers of total populations by age; the lower represents the numbers of female populations. The spikes of population numbers at age 85 are due to the top censoring of age beginning in 2000.

