Figure 3.

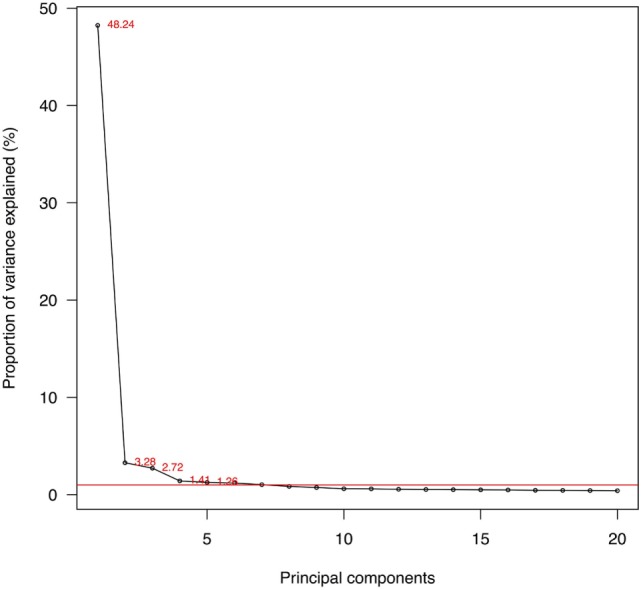
Proportions of variances explained by the first 20 principal components (PCs). Note: red line: 1% of total variance; 525 PCs in total.

Proportions of variances explained by the first 20 principal components (PCs). Note: red line: 1% of total variance; 525 PCs in total.