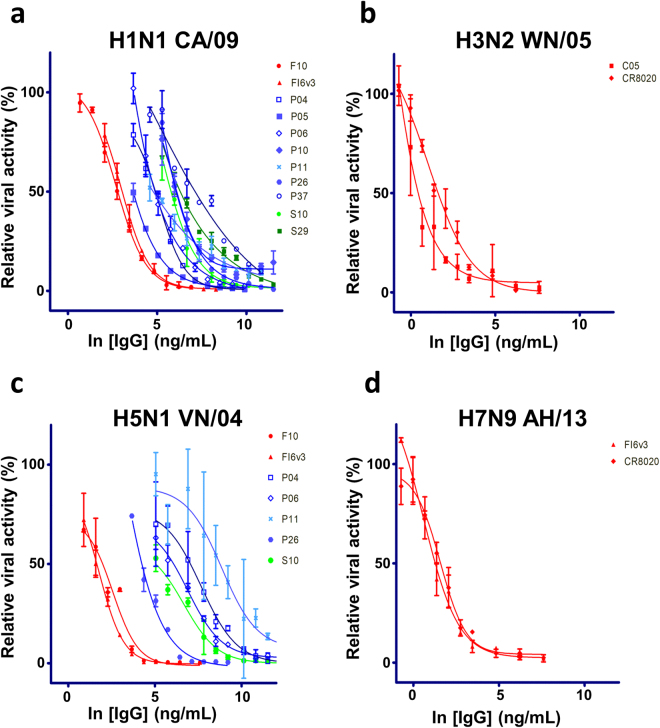
Figure 6.
IC50 measurements with pseudo virus-based microneutralization assay for the IgGs reformatted from the selected anti-HA trimer scFvs. (a)~(d) The IgGs were reformatted from the selected anti-HA trimer scFvs as shown in Fig. 3. The y-axis shows the relative viral activity plotted against the IgG concentration (x-axis). The experimental details are described in Methods. The CDR sequences of these IgGs are shown in Supplementary Table S3, and the numerical values of the IC50’s are listed in Supplementary Table S4. The error bars associated with the data points are calculated with at least three independent repeats of the microneutralization assay. The positive control IgGs: F107, FI6v334, C0541, and CR802042 were prepared as described in Methods.

