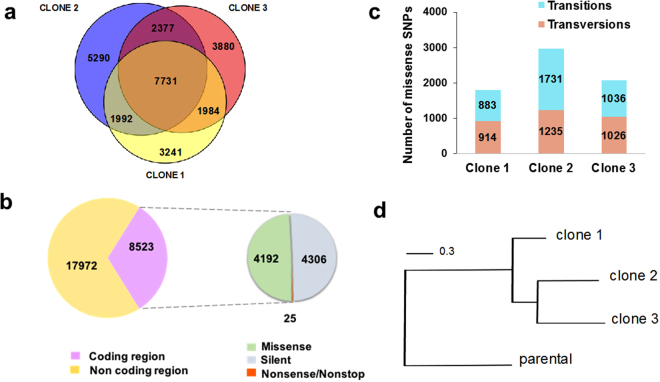
Figure 1.
Analysis of SNPs identified in T. cruzi clones selected for benznidazole-resistance. (a) Venn diagram illustrating the distribution of 26,495 distinct SNPs identified by genome sequencing of three drug-resistant clones. (b) The total number of SNPs in coding and non-coding genomic regions are shown in purple and yellow. The smaller circle (right) illustrates SNP distribution within coding regions: missense (green), silent (grey) and nonsense/nonstop (orange). (c) Classification of missense SNPs as transitions (purine ↔ purine; blue) or transversions (purine ↔ pyrimidine; pink). (d) Maximum-likelihood phylogenetic tree based on nucleotide alignment (FastTree program), showing relationship between parental and drug-resistant T. cruzi clones. Scale bar represents the number of substitutions per site.

