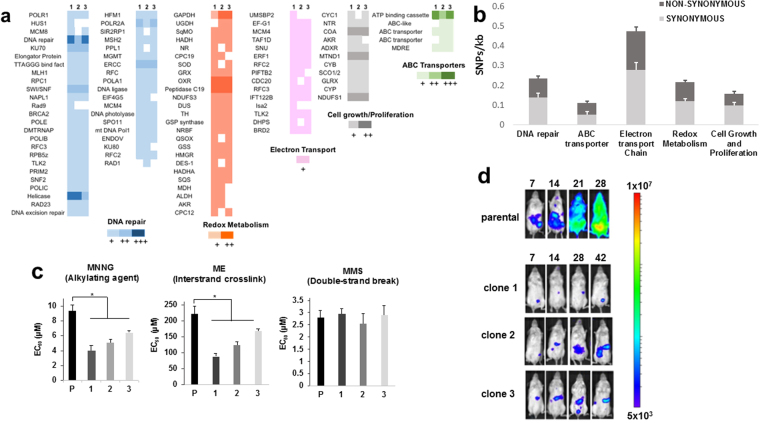
Figure 3.
Genetic and phenotypic changes in benznidazole-resistant clones. (a) Total point mutations in genes linked to DNA repair, redox metabolism, electron transport, cell growth and proliferation, and ABC transporter activity, in each of the three clones. The colour scale indicates the number of mutations per gene: 1 (+), 2 (++), or 3 or more (+++). (b) Average SNPs/kb in genes from different functional categories in the 3 clones. Synonymous and non-synonymous SNPs are shown. (c) Sensitivity of parental and drug-resistant parasites to the DNA damaging agents methyl-3-nitro-1-nitrosoguanidine (MNNG), mechlorethamine (ME) and methyl methanesulfonate (MMS) (Methods). Statistical analysis was performed using one-way analysis of variance; p values, respectively: 0.02, 0.01, 0.02 (MNNG); 0.002, 0.003, 0.02 (ME). (d) Bioluminescence imaging of SCID mice infected i.p. with parental and drug-resistant clones (104 tissue culture trypomastigotes). Parasites were genetically transformed to express the luciferase reporter gene PpyRe9h 17,28 (Methods). Ventral images of representative mice (n = 3) are shown, with the number of days post-infection given above. Heat maps indicate the intensity of bioluminescence from low (blue) to high (red) (log10 scale); the minimum and maximum radiances for the pseudocolour scale are shown. The mice infected with the parental Y strain required euthanization on day 28, in accordance with animal welfare requirements (Methods).

