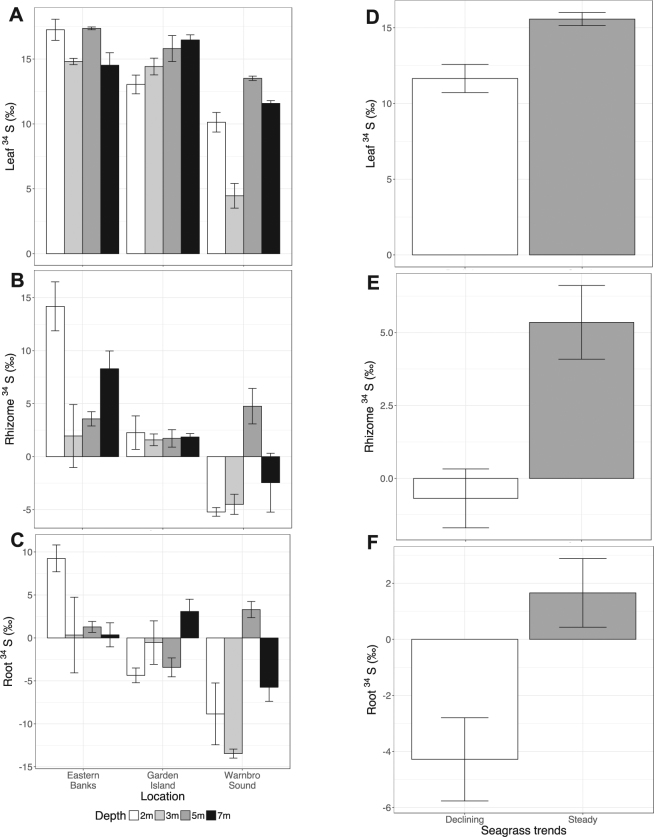
Figure 1.
Mean δ34S for seagrasses in Cockburn and Warnbro Sound. (A) Leaf, (B) Rhizome and (C) Root δ34S of seagrasses across three regions in Cockburn and Warnbro Sound. Colour of bars represent depth of sites (white = 2 m, light grey = 3 m, dark grey = 5 m, black = 7 m). Each bar represents the mean δ34S at each site, with error bars representing 1 standard error (n = 3). Mean (D) Leaf, (E) Rhizome and (F) Root δ34S grouped by long-term trends in shoot density at each site. White bars represent sites with a history of shoot declines, while grey bars are from sites with no shoot declines12. Each bar represents the mean δ34S, with error bars representing 1 standard error (n = 18).

