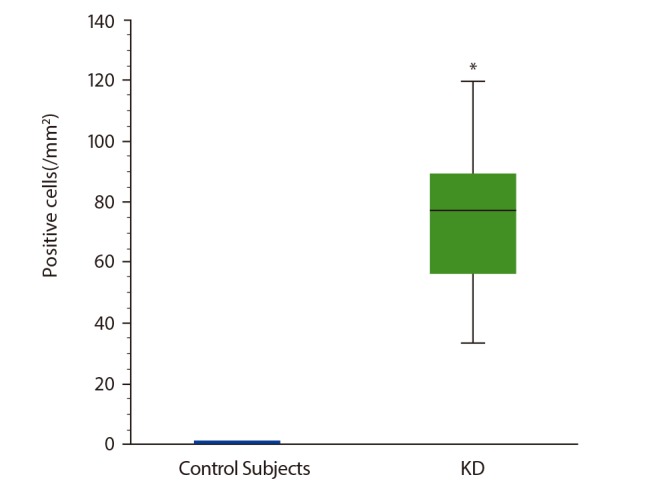
Fig. 1. Numbers of proMBP1-positive cells in KD and normal parotid glands. Box plots represent the median values with 25% and 75% interquartiles. The error bars represent the 10th and 90th percentiles. Each group, n = 6. *p < 0.01. proMBP1, pro-form of major basic protein 1.

