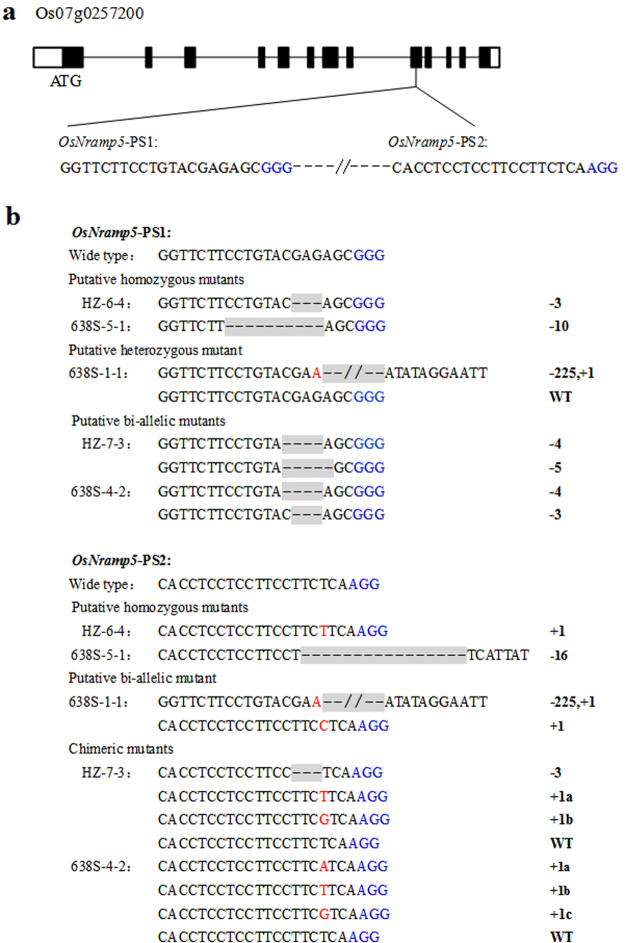
Figure 1.
CRISPR/Cas9-induced mutations in the OsNramp5 gene. (a) Schematic diagram of OsNramp5 gene structure and two CRISPR/Cas9 target sites. UTRs, exons, and introns are indicated by blank rectangles, black rectangles, and black lines, respectively. The 20-nt target sequences are shown at the bottom of the gene structure, and the following PAMs (NGG) are highlighted in blue. (b) The mutant OsNramp5 genotypes of representative T0 plants are identified by DNA sequencing and alignment. Deletions and insertions are indicated by dashes and red letters, respectively. The numbers on the right side show the sizes of the indels, with “−” and “+” indicating deletion and insertion of the nucleotides involved, respectively. The letters after the numbers represent different bases of the same length.

