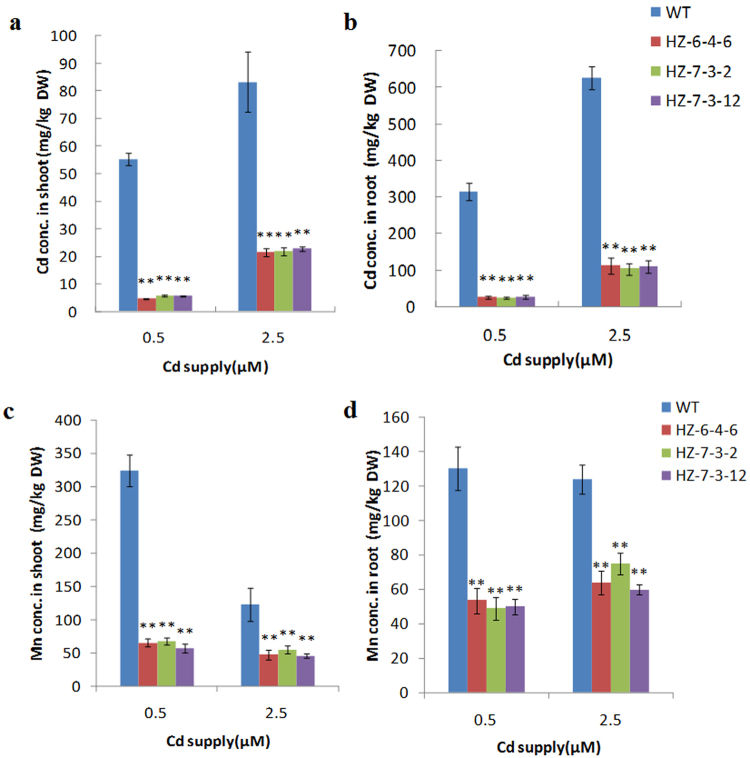
Figure 3.
Concentrations of Cd and Mn in shoots and roots at different Cd levels. Three osnramp5 mutant lines (HZ-6-4-6, HZ-7-3-2, HZ-7-3-12) and WT plants (HZ) were grown in normal nutrient solution for 2 weeks and then transferred to the nutrient solution containing 0.5 or 2.5 µM Cd for another 2 weeks. The shoots and roots were harvested and subjected to mineral analysis by inductively coupled plasma optical emission spectrometry (ICP-OES). (a and b) Cd concentrations in the shoots (a) and roots (b). (c and d) Mn concentrations in the shoots (c) and roots (d). DW, dry weight. Data are means ± SD of three biological replicates, and three plants were mixed in one replication for metal determination. Two asterisks indicate statistically significant difference in comparison to WT at P < 0.01 by Student’s t test.

