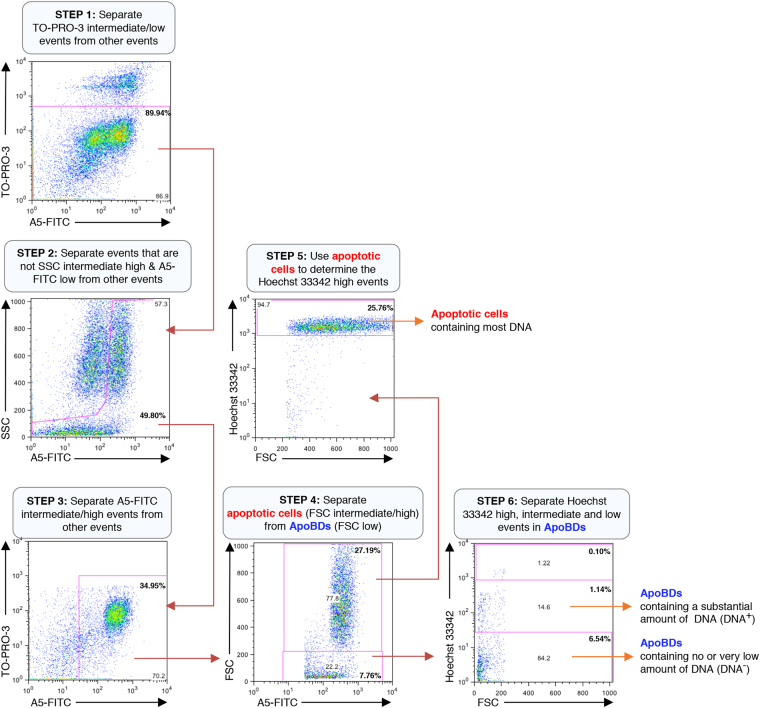
Figure 1.
Electronic gating strategy for analysis of DNA content in ApoBDs generated from apoptotic Jurkat T cells. Flow cytometry analysis showing the six-stage electronic gating strategy used to identify ApoBDs with different amount of DNA from a sample containing a mixture of viable cells, apoptotic cells, necrotic cells, cell debris and ApoBDs. The final percentages of ApoBDs containing different amount of DNA relative to all the cells/particles in the sample are included on the flow cytometry plots (bold). The gating of Hoechst 33342 low events is determined based on unstained sample. Data are representative of at least three independent experiments.

