
Figure 1. The human mitochondrial genome.
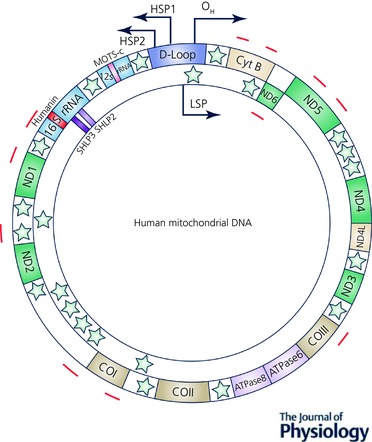
Relative locations of genes are represented as coloured blocks including humanin (red), MOTS‐c (yellow), SHLP2 and SHLP3 (pink and magenta, respectively). Twenty‐two tRNAs encoded from mitochondria are represented as green stars. Potential epigenetic modulation CpG sites in the mtDNA are marked in brown and the coordinates were obtained from Yu et al. 2017.