
Figure 1. Activation of 8A‐VFP/8E‐mCh by oxidation.
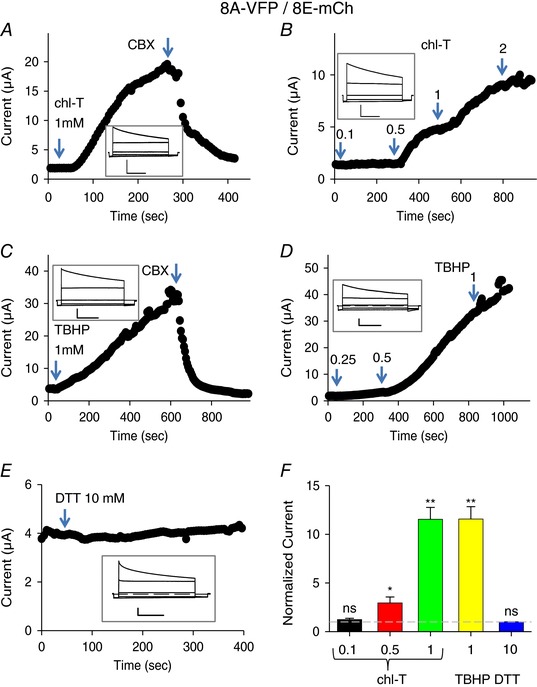
A–E, typical experiments illustrating the effect of application of chloramine‐T (A and B), TBHP (C and D) or DTT to oocytes co‐expressing 8A‐VFP and 8E‐mCh. The concentration is indicated in the figure. Time course of current recorded with a test pulse at +60 mV from a holding potential of −30 mV. Arrowhead indicates time of application of 100 μm CBX blocker. The inset shows the typical VRAC currents in response to an I–V protocol stimulation from −100 to +60 mV every 40 mV. Horizontal scale bars, 1 s; vertical scale bars, 1 μA (A, C and E), 2 μA (B) and 0.5 μA (D). F, average current response to the indicated stimuli, normalized to the initial current. Dashed line indicates basal current level (one‐sample t test with respect to control value 1, 0.1 mm chloramine‐T (chl‐T), P = 0.19, n = 4; 0.5 mm chl‐T, P = 0.048*, n = 4; 1 mm chl‐T, P = 0.00001**, n = 10; 1 mm TBHP, P = 0.00016**, n = 7; 10 mm DTT, P = 0.14, n = 3; error bars indicate SEM). Please note the different time and current scales in the various panels. [Color figure can be viewed at wileyonlinelibrary.com]