
Figure 5. Effects of redox conditions on 8A‐VFP/8D‐mCh.
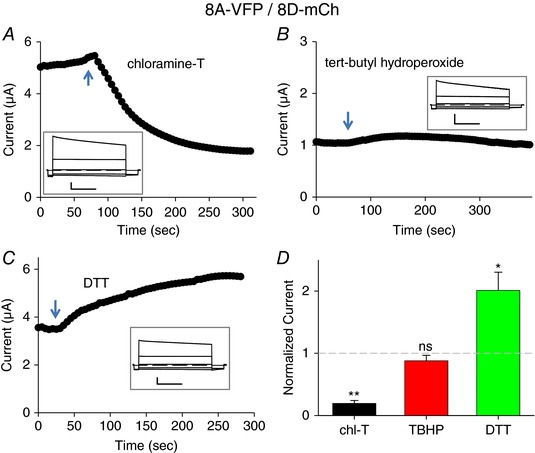
A–C, typical experiments illustrating the effect of application of 1 mm chloramine‐T (A), 1 mm TBHP (B) or 10 mm DTT (C) to oocytes co‐expressing 8A‐VFP and 8D‐mCh at the indicated time points. The inset shows response to an I–V stimulation before stimulus application. Horizontal scale bars, 1 s; vertical scale bars, 1 μA (A and C) and 0.5 μA (B). D, average response to the indicated stimuli, normalized to the initial current (one‐sample t test with respect to control value 1, chl‐T, P = 0.0004**, n = 4; TBHN, P = 0.26, n = 4; DTT, P = 0.041*, n = 4; error bars indicate SEM). Note the different time and current scales in the various panels. [Color figure can be viewed at wileyonlinelibrary.com]