
Figure 6. Effect of chloramine‐T on hypotonicity‐activated 8A‐VFP/8C‐mCh (A) and 8A‐VFP/8D‐mCh (B).
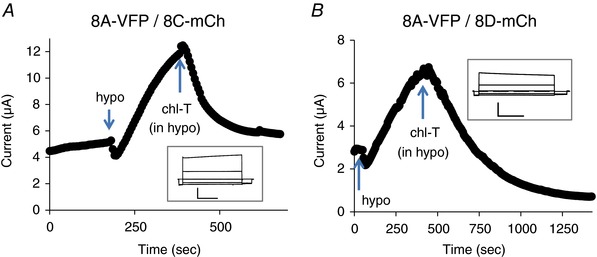
The insets show responses to an I–V stimulation before hypotonic stimulation. Horizontal scale bars, 1 s; vertical scale bars, 2 μA. Similar results were obtained for n = 3 oocytes each. Note the different time and current scales in the various panels. [Color figure can be viewed at wileyonlinelibrary.com]