
Figure 8. Effect of cysteine‐modifying reagents on chloramine‐T action on 8A‐VFP/8E‐mCh heteromers.
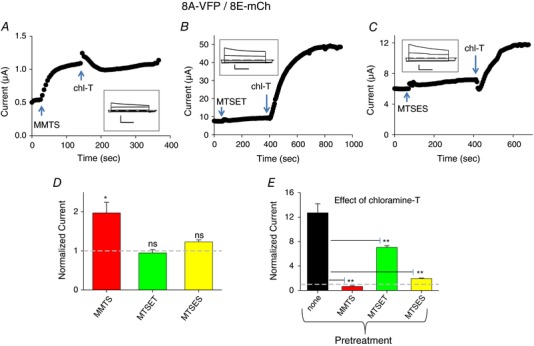
A–C, typical experiments illustrating the effect of application of 1 mm MMTS (A), MTSET (B), and MTSES (C) and subsequent application of 1 mm chloramine‐T on different 8A‐VFP/8E‐mCh‐expressing oocytes. The insets show traces before application of the cysteine‐reactive compounds. Horizontal scale bars, 1 s; vertical scale bars, 0.5 μA (A) and 2 μA (B and C). D, effect of cysteine‐modifying reagents, normalized to the basal current (indicated by a dashed line; one‐sample t test with respect to control value 1, MMTS, P = 0.037*, n = 4; MTSET, P = 0.59, n = 3; MTSES, P = 0.052, n = 3; error bars indicate SEM). E, average response to the application of 1 mm chloramine‐T after pretreatment with cysteine‐modifying reagents, normalized to the current before chloramine‐T application (n ≥ 3 each, error bars indicate SEM). The column indicated by ‘none’ is the same as that of Fig. 1 D. Pretreatment with cysteine‐modifying reagents decreased in a significant manner the subsequent effect of chloramine‐T (ANOVA, post hoc Tukey's test, P < 0.01** indicated only with respect to no pretreatment). Note the different time and current scales in the various panels. [Color figure can be viewed at wileyonlinelibrary.com]