
Figure 10. Effect of chloramine‐T on volume‐dependent anion currents in Jurkat T cells.
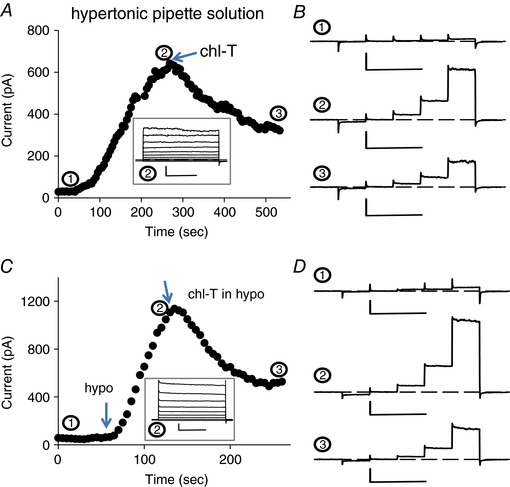
A and B, typical experiment illustrating the effect of application of 500 μm chloramine‐T on a cell after stimulation of VRAC by a hypertonic intracellular solution. The current at 100 mV is plotted as a function of time. The traces in B show the current response to 50 ms steps to −100, −50, 0, 50 and 100 mV at the indicated time points (horizontal scale bars, 100 ms; vertical scale bars, 200 pA). C and D, typical experiment illustrating the effect of application of 500 μm chloramine‐T on a cell after stimulation of VRAC by a hypotonic extracellular solution. Insets show the response to an I–V stimulation after maximal activation. Horizontal scale bars, 200 ms; vertical scale bars, 200 pA. [Color figure can be viewed at wileyonlinelibrary.com]