
Figure 11. Quantification of LRRC8 subunit expression in Jurkat cells.
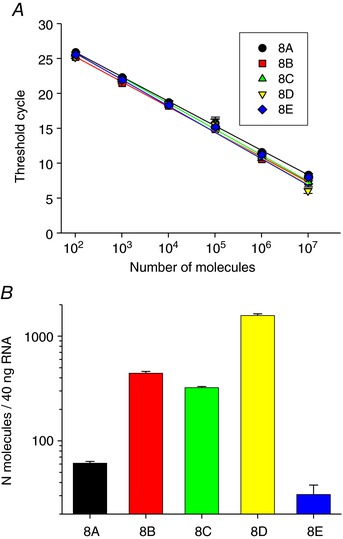
A, standard curves of LRRC8A–E are shown. Curves were generated performing qPCR on serial dilutions of the plasmids containing the respective cDNAs. The lines represent the best linear fit to the experimental data. Error bars indicate standard deviation. Slope, y‐intercept of the linear fit and calculated efficiency are, respectively: 8A: −3.53, 32.9, 92%; 8B: −3.59, 32.4, 89.9%; 8C: −3.71, 33.4, 85.9%; 8D: −3.78; 33.2, 84.6%; 8E: −3.52, 32.5; 92.5%. B, expression of LRRC8 subunits reported as number of molecules in 40 ng of RNA, as determined from the calibration curve shown in A. Data are from two independent experiments and six technical replicates. [Color figure can be viewed at wileyonlinelibrary.com]